Added value of the coreVIEWER app
- Easy to use, even for non-technicians
- Wireless, stable data transmission via Bluetooth
- Live display for sensors with core sensing measuring amplifiers
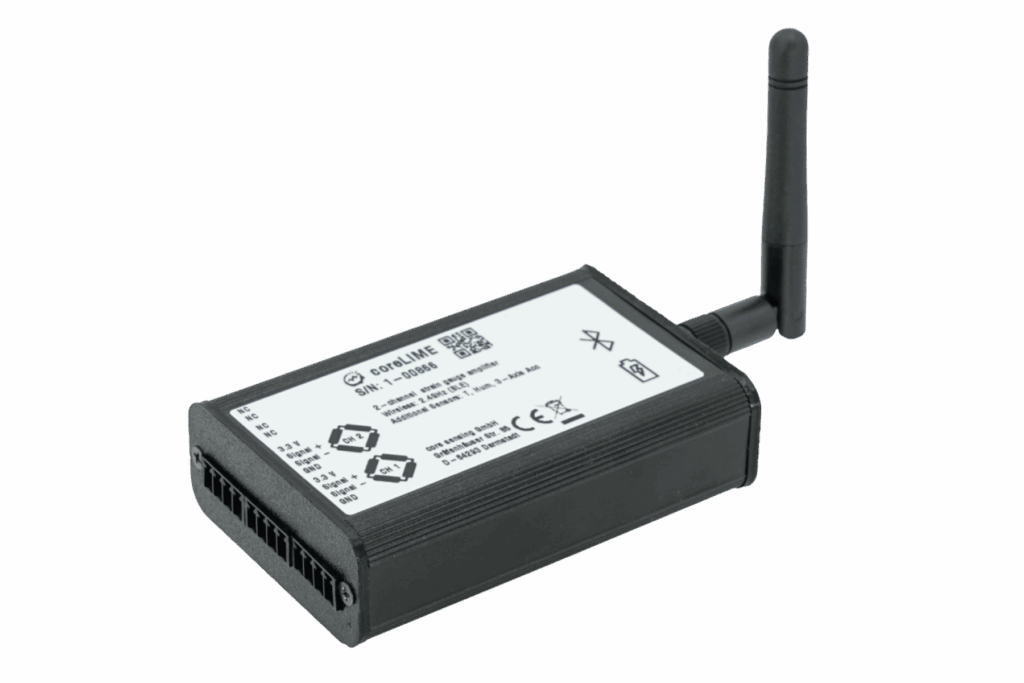
- Data logging up to 1,000 sps on mobile device and on coreLIME measuring amplifier
- Export recordings as .csv, direct viewing and editing possible in the software
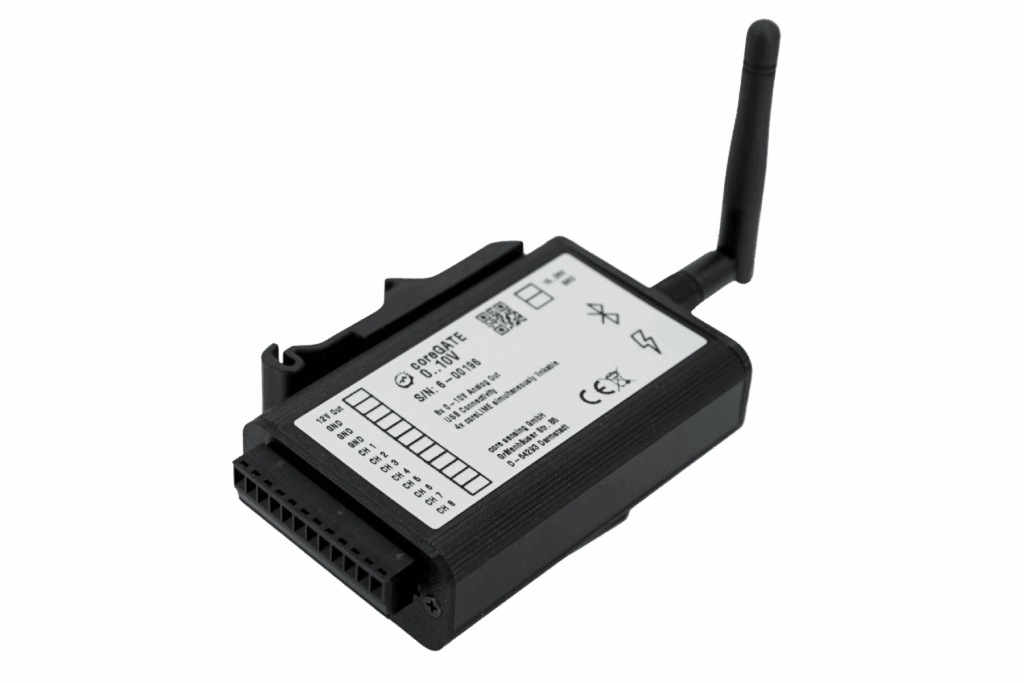
- Configuration of coreGATE gateways
- Simultaneous connection of up to four coreLIME measuring amplifiers
- Configuration of calibration value, transmission rate, power options, and much more
- Available for free download
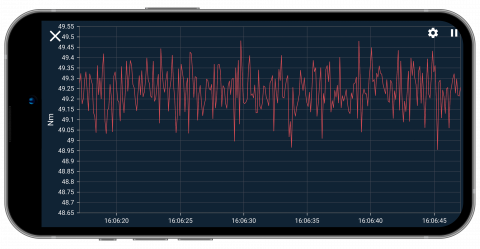
coreVIEWER Custom Dashboard
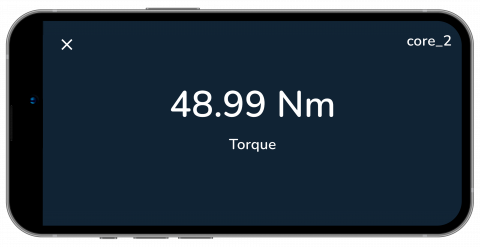
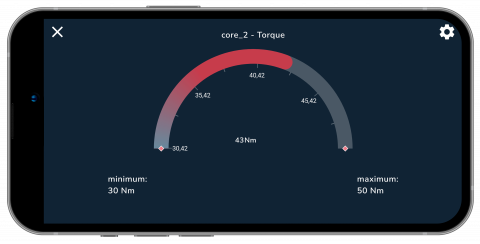
Get a quick picture! As soon as you connect a torque or force sensor, all measured variables of a sensory component are clearly displayed in the dashboard, allowing you to easily keep an eye on the most important measured values of various components. In custom mode, you can display exactly the measured variables that are of particular interest to you – from up to four measuring amplifiers simultaneously.
- View as Line Chart
- Live value as digital display
- Min/Max/Average value for adjustable period
- Tare
- Tab switching between connected sensors
- Schedule and start recording measurement data
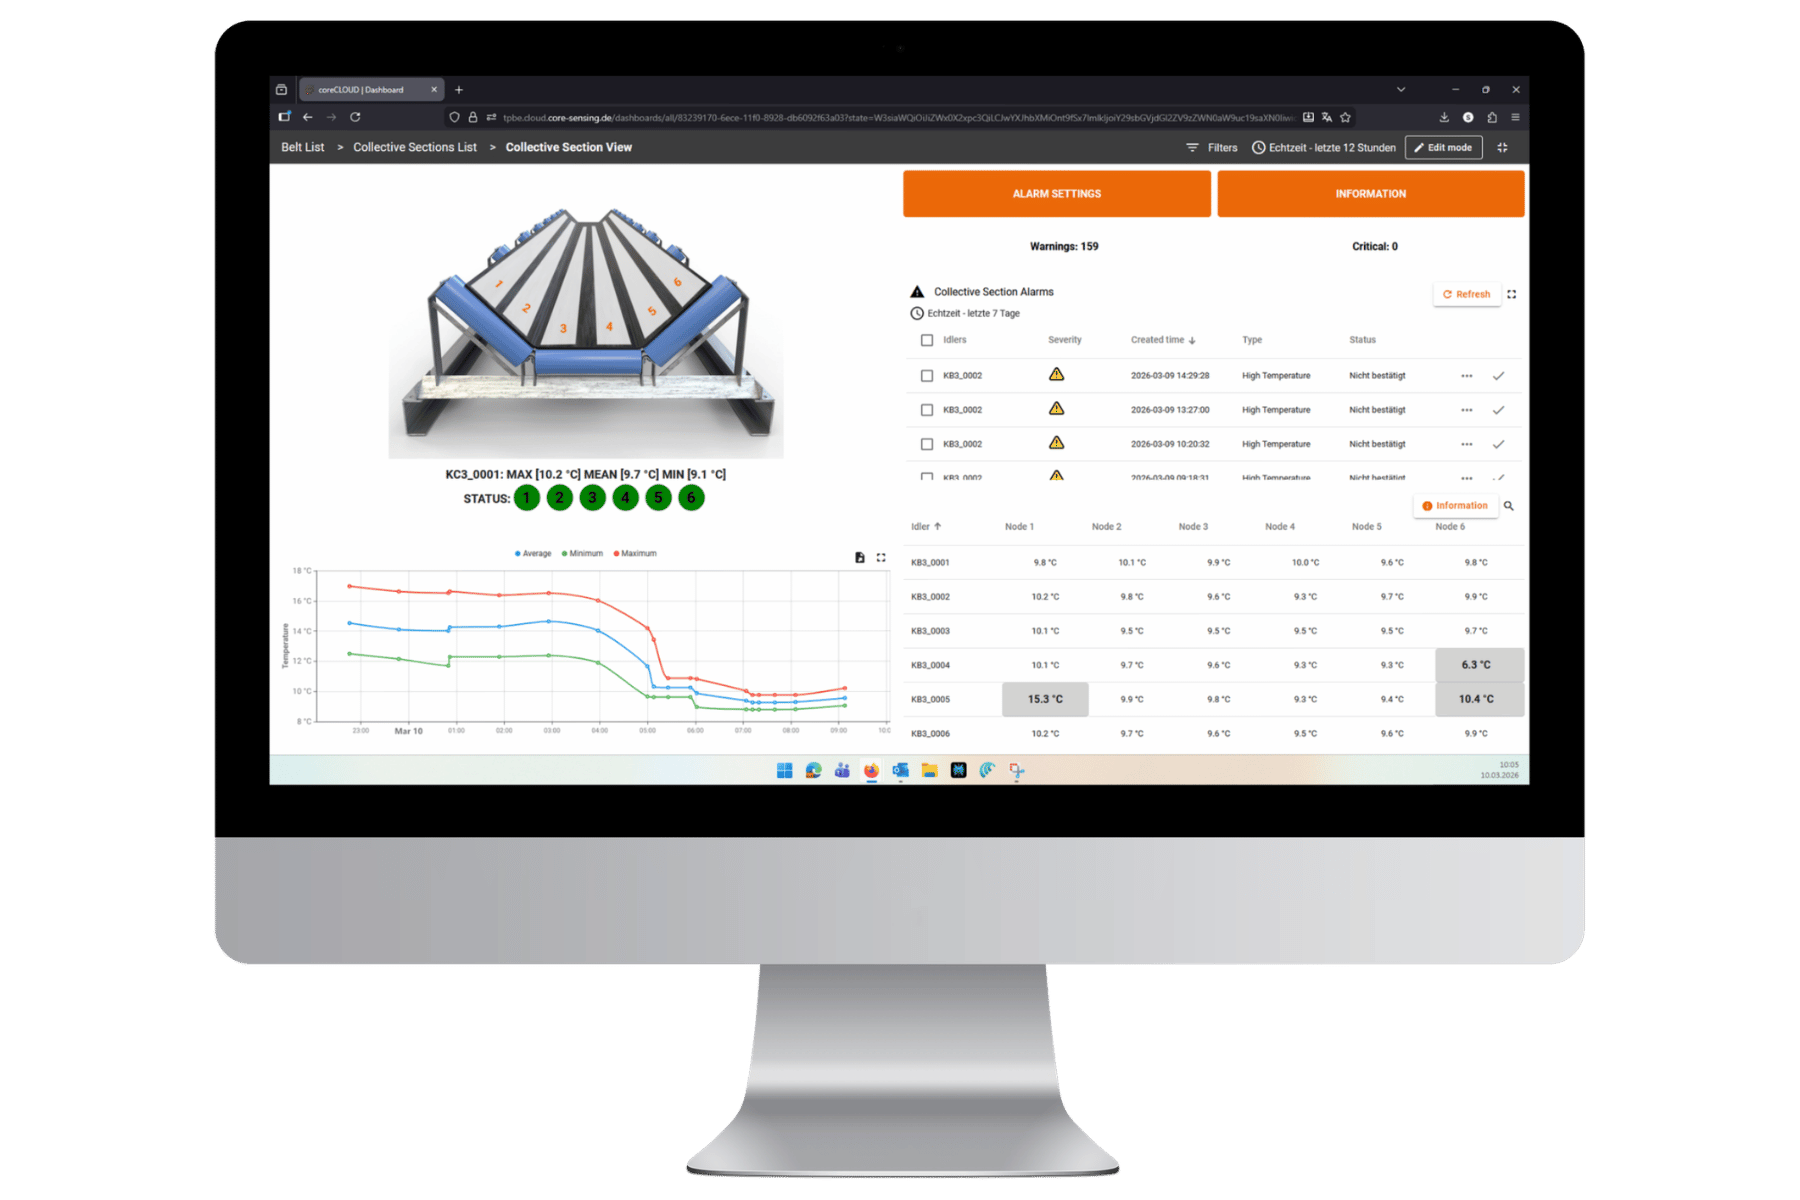
coreVIEWER Web – browser-based data visualization
coreVIEWER Web is a free, browser-based software for visualizing and easily editing measurement data recorded with coreLIME-based sensors. It does not matter whether the data is stored on the amplifier or on the mobile device.
The .csv file is loaded into the software via the upload icon in the top right corner. The data remains exclusively local; there is no interface, transmission, or information flow to the network.
Note: The software may not be compatible with some browsers (especially Safari). Please use a different browser if it does not work.