coreCLOUD
Visualization, monitoring, analytical processing, and storage of live and historical data in the cloud
- Low-latency monitoring of live data
- Historical data, notifications, and alerts
- Branding and custom dashboards available
- Integration and API available
Powerful platform for fleet, device, and event management
In the device management section, battery level, location, and alert lists can be displayed for each measuring amplifier/sensor. User management allows for the creation of different user types with varying access rights.
Display and measurement data management
Live measurement data or the entire measurement data history can be displayed for each sensor channel. An intuitive measurement data view, including a zoom function and quick access to historical data, enables easy handling of even large volumes of data. Measurement series can be exported and downloaded as CSV or Excel files, as well as screenshots, with a single click.
Individual dashboards with configurable widgets
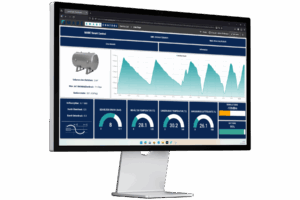
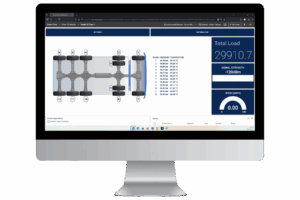
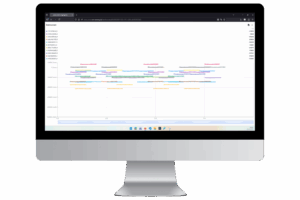
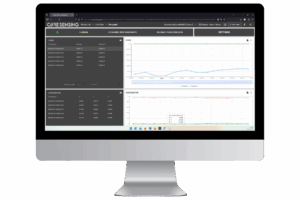
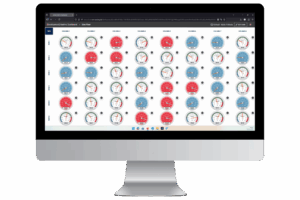
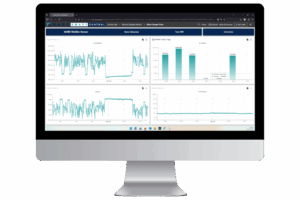
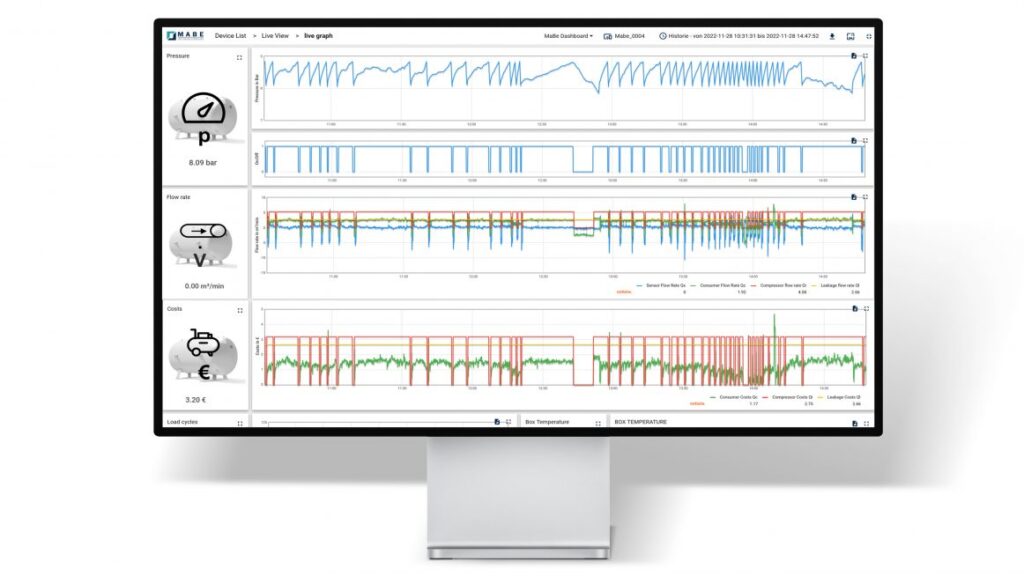
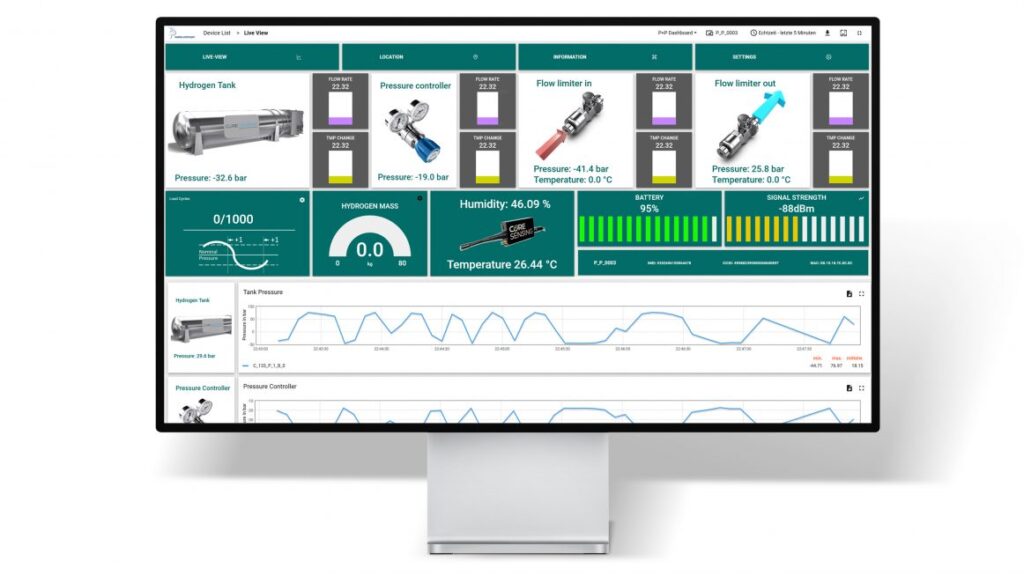
Widgets such as speedometers, bar charts, and warning elements are available as standard. This allows desired interpretations and recommendations for action to be displayed graphically: for example, when the next maintenance is due. Events such as overloads can be displayed in clusters, and a click provides detailed information. Usage diagrams enable the visualization of usage intensity over a defined period. Threshold violations can be counted, and damage amounts can be calculated directly.
Rule chains and algorithms
From simple, rule-based logic to complex analytical processes – scalable in custom services.
Versatile interfaces – maximum security
A REST API interface is available for integrating coreCLOUD into external systems. Additionally, to ensure the best possible security for your data, we offer dedicated hosting upon request.