The intuitive mobile app for measuring and configuring core sensing sensors, measurement amplifiers and IoT gateways.
The coreVIEWER app is the heart of our IoT sensor platform and your mobile measured value display for all relevant measured variables. It is available free of charge in the Google Playstore and Apple App Store and is intuitive to use.
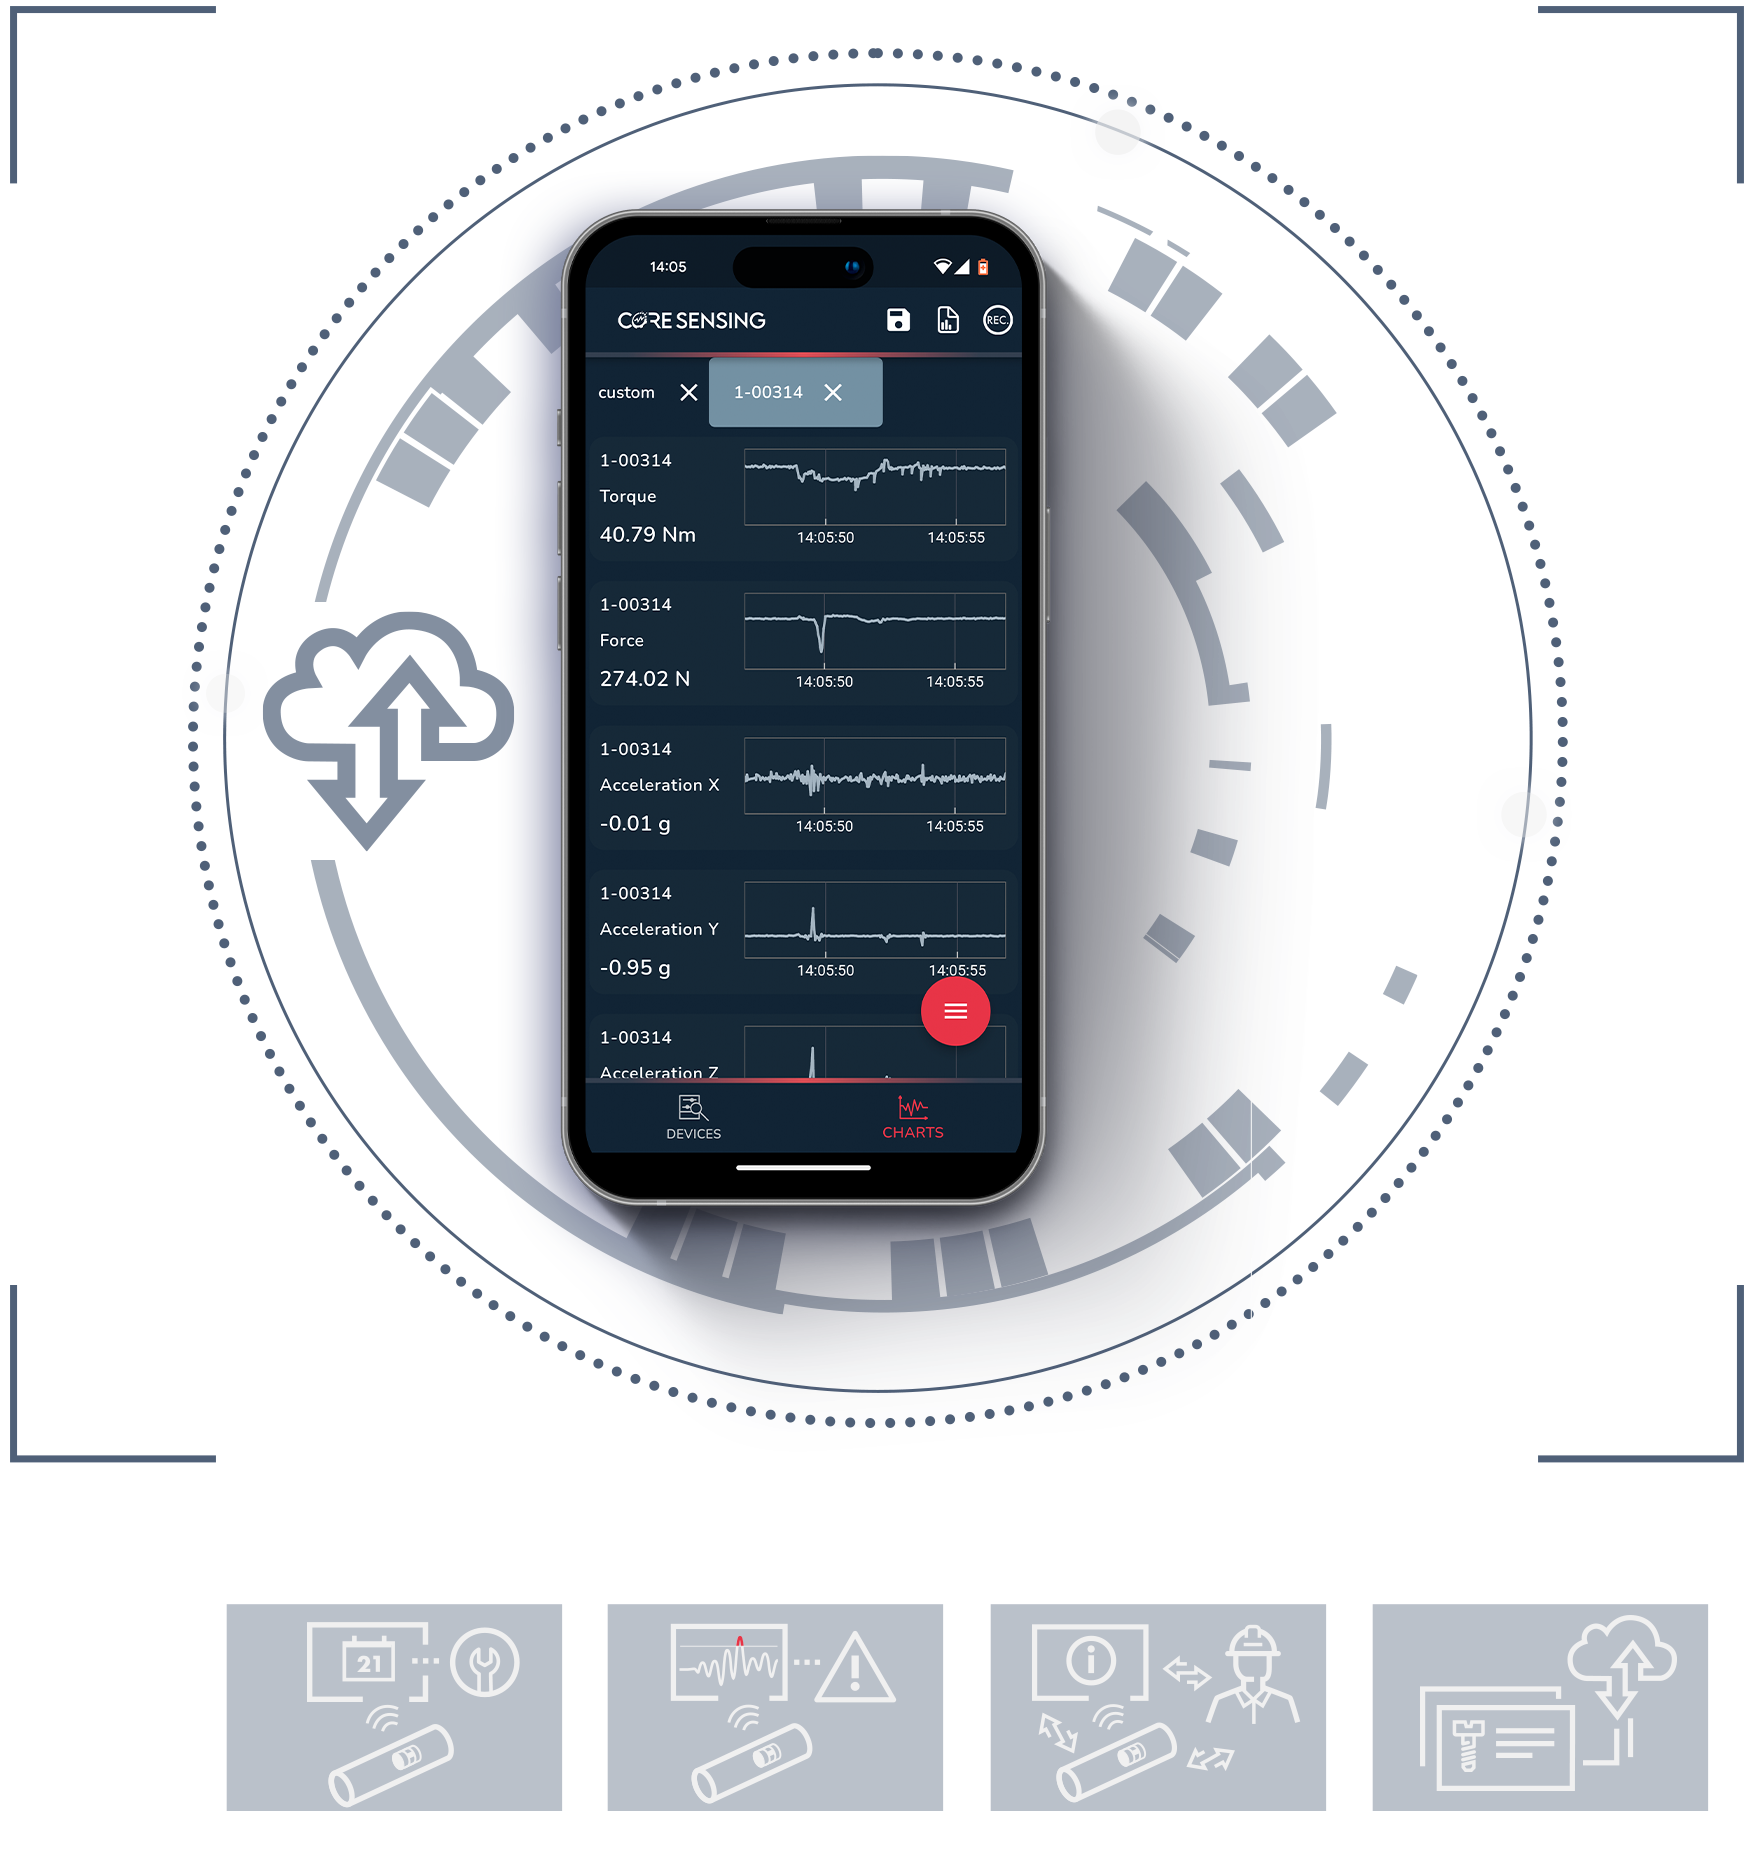
With coreVIEWER, you have full control over your smart sensors. The app is the direct interface between the sensors and you as the user. It makes all measured values visible via various graphs and tools and allows you to configure your sensor nodes and IoT gateways.
coreVIEWER in short portrait
Overview of all available sensors
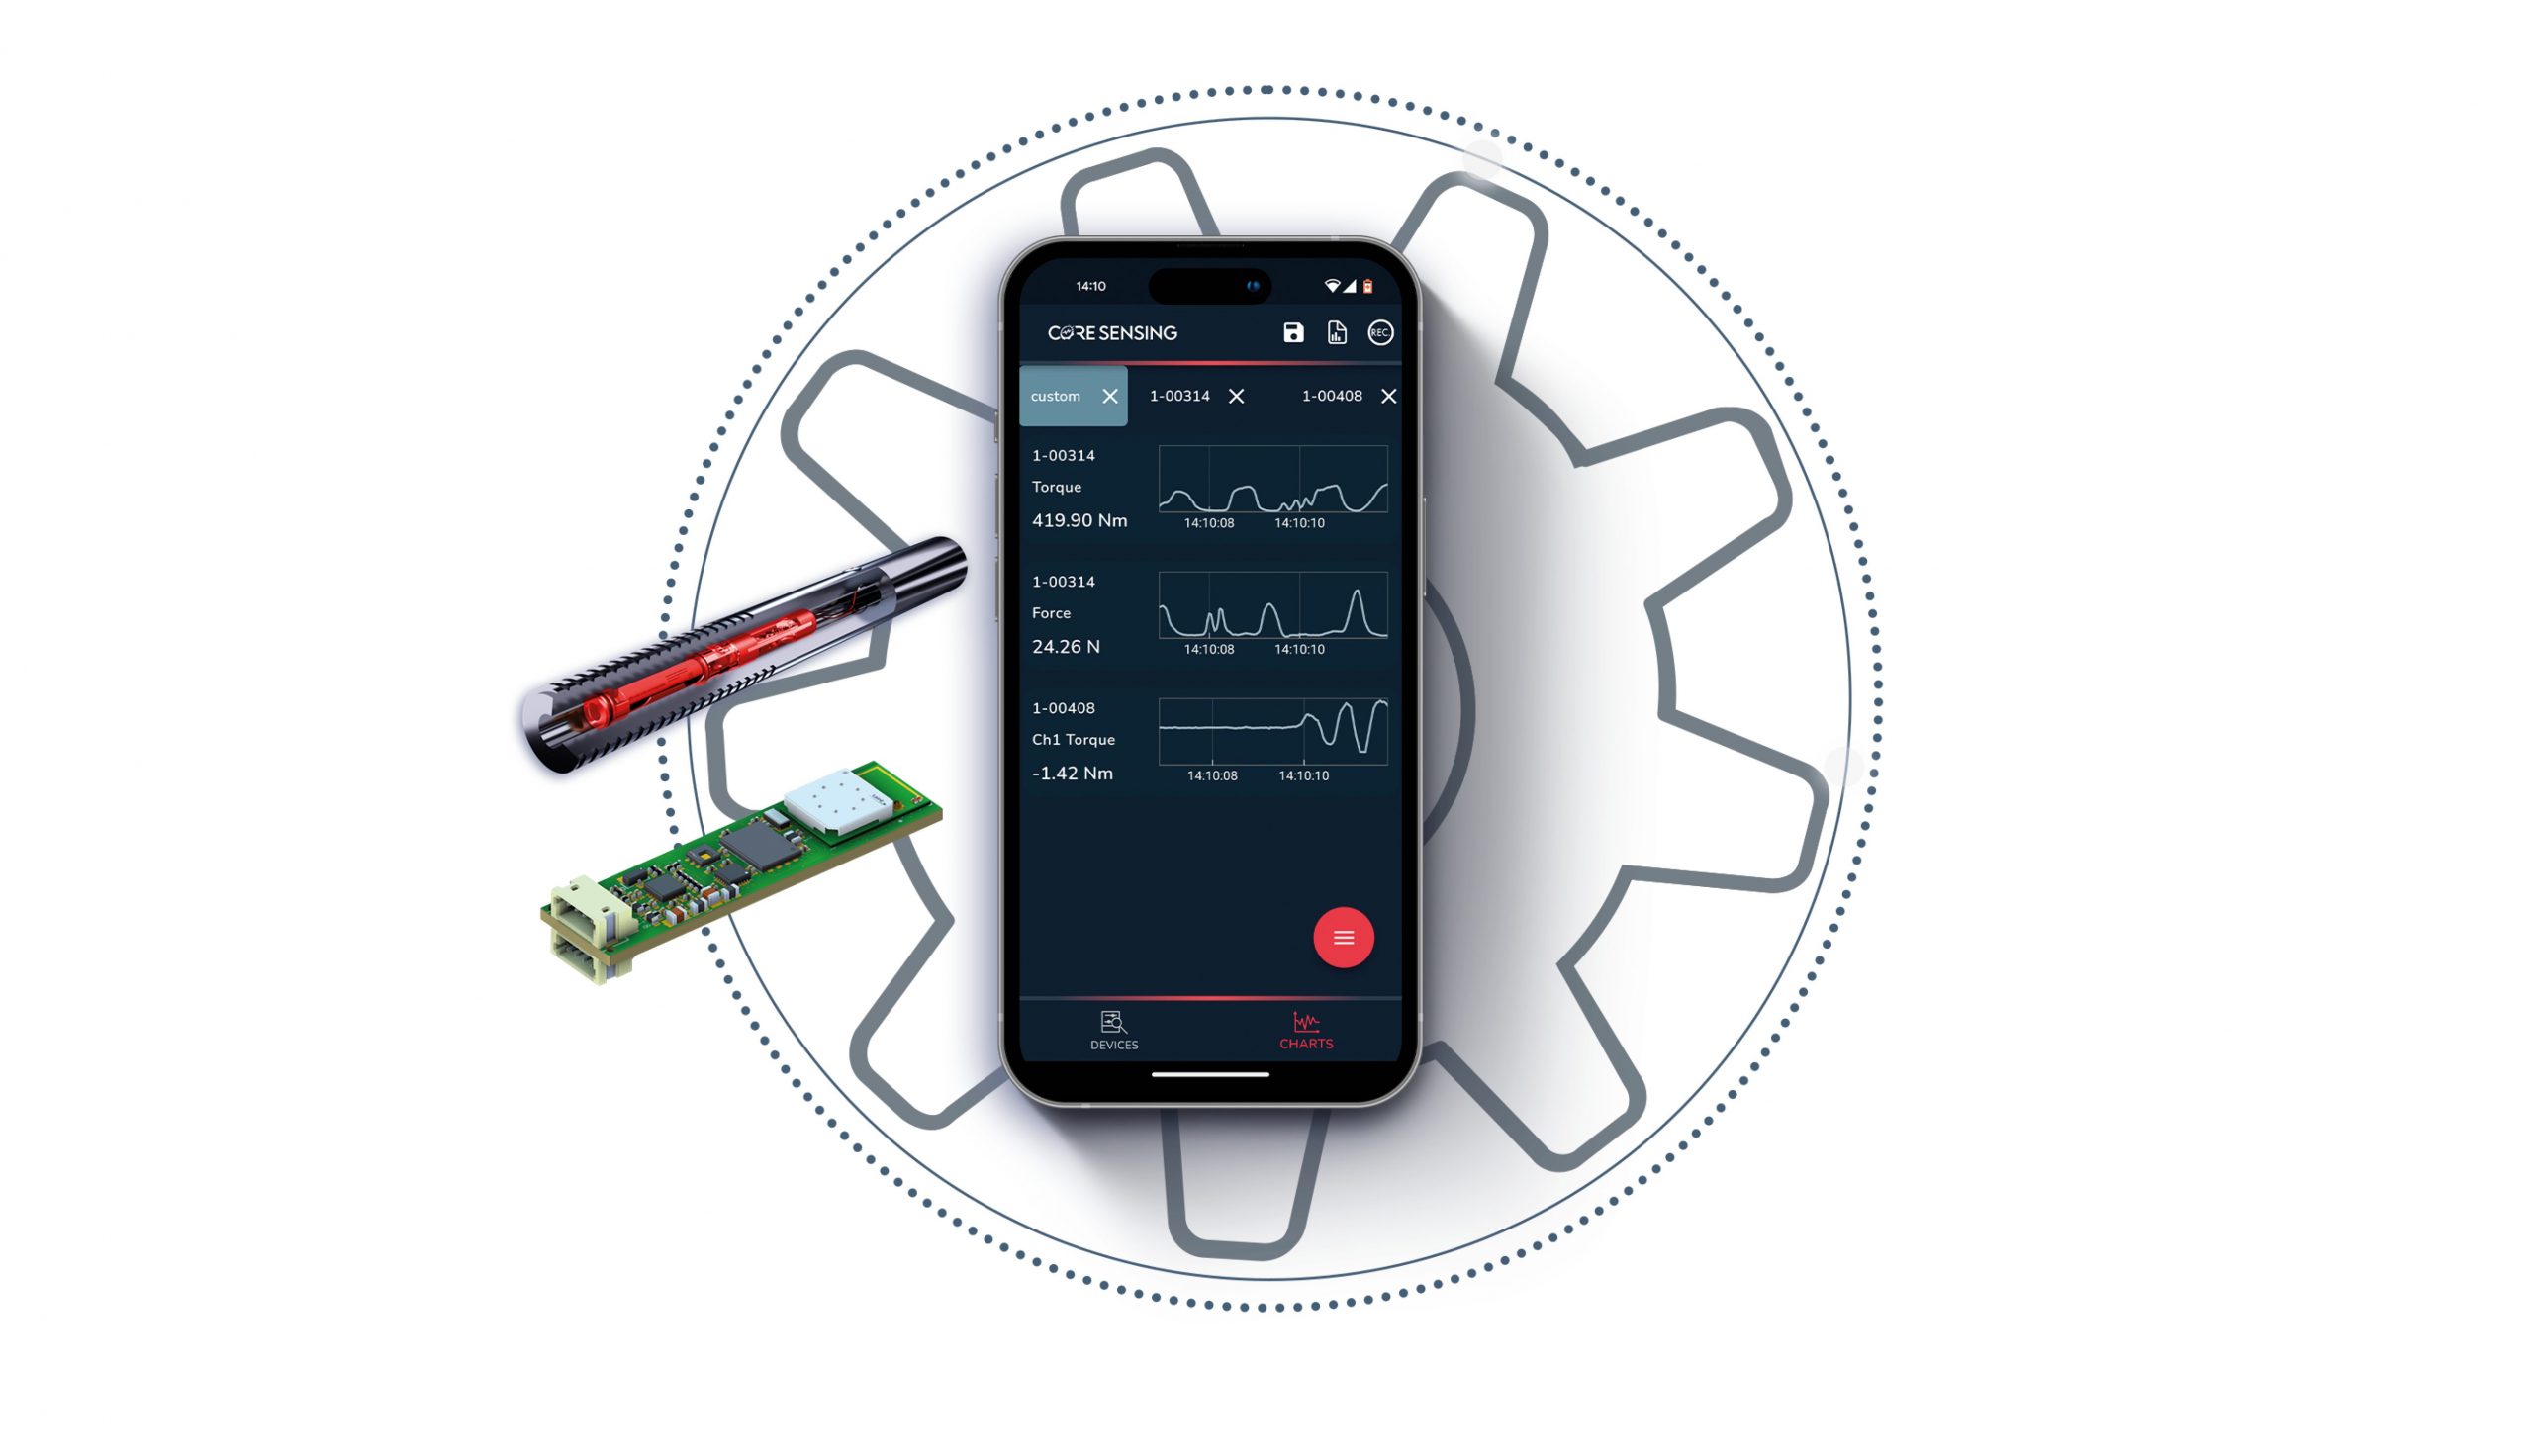
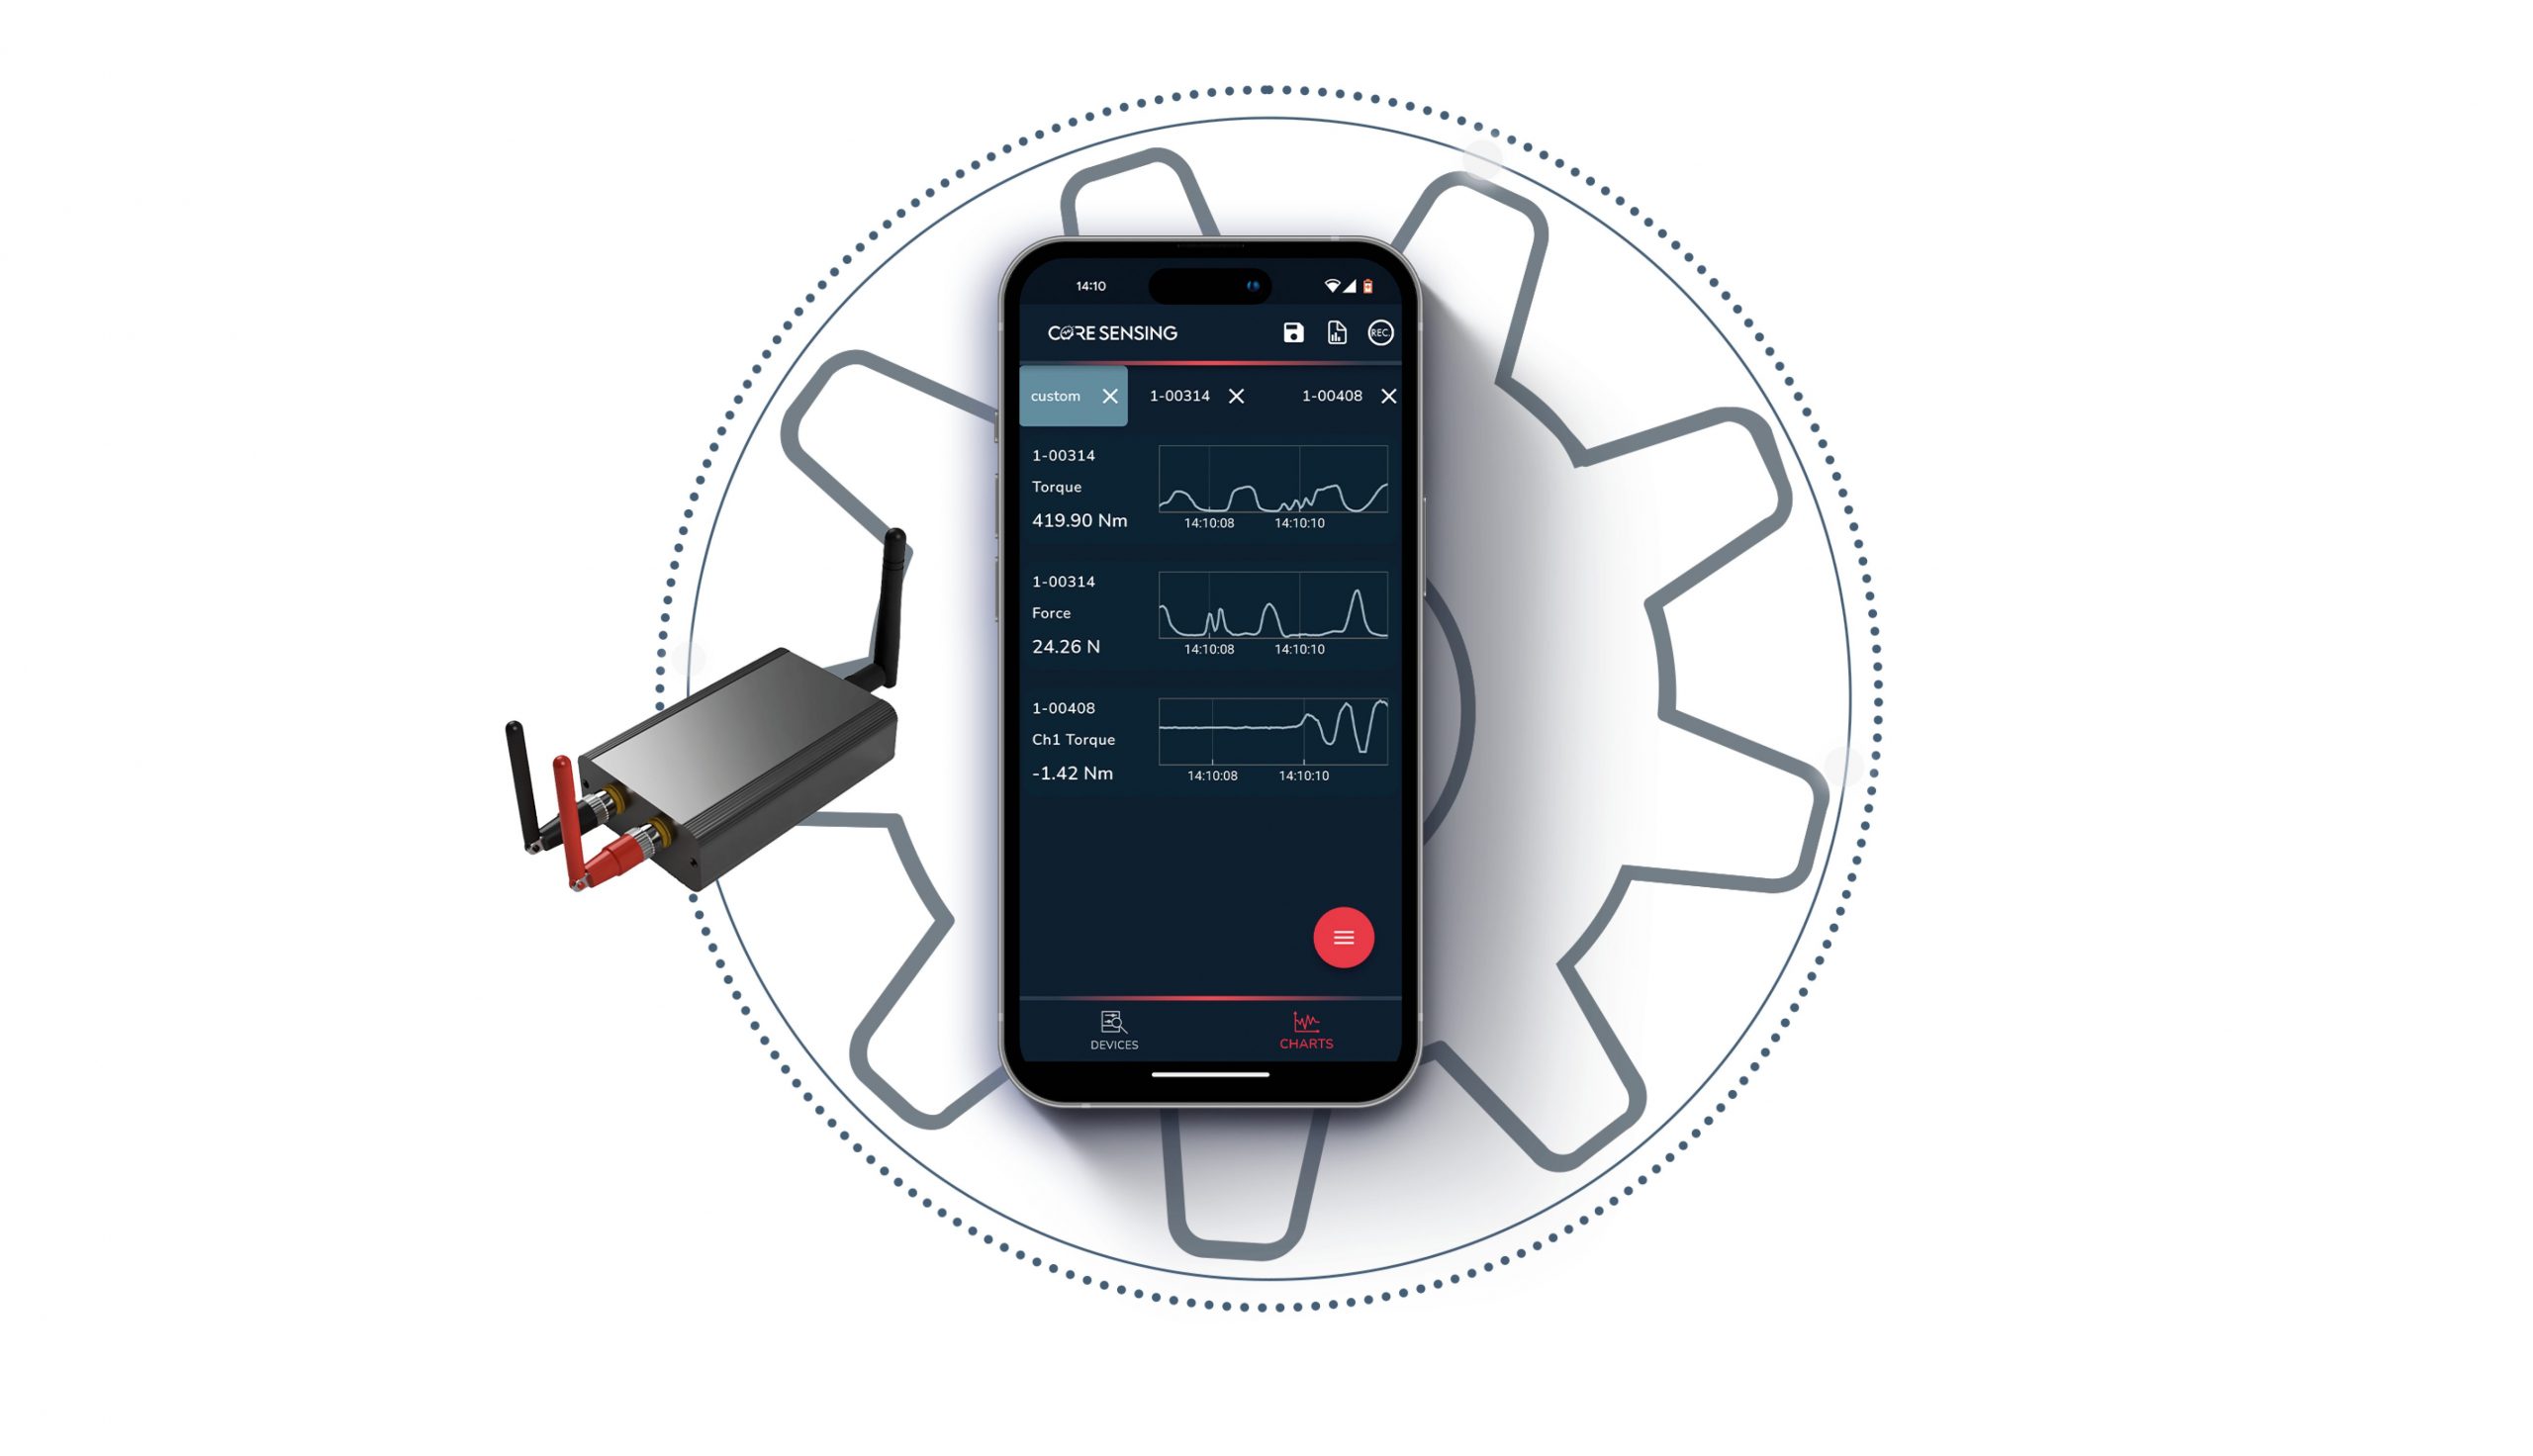
Simultaneous connection with up to 4 sensor nodes
Live display of measured values
Configuring sensor nodes and gateway
Starting, ending and displaying recordings
Creation of your own dashboards
Setting threshold values and events
Download for Android and iPhone
Save measured values directly on the smartphone & tablet
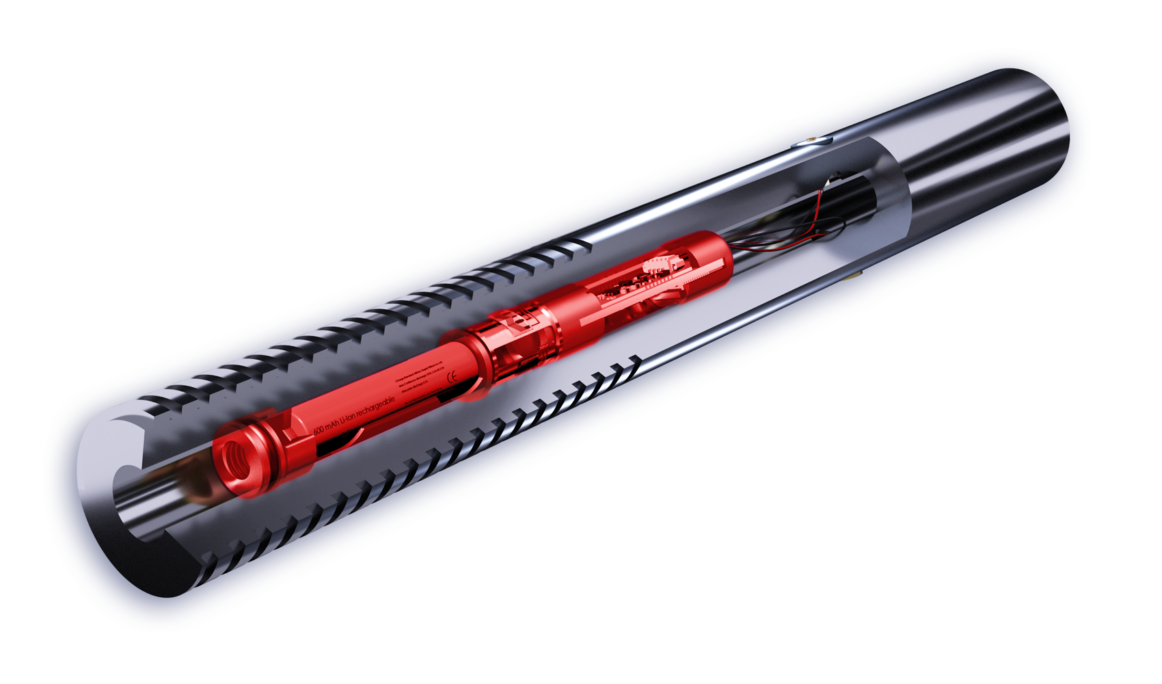
By activating logging, the measured values are saved directly to the internal memory of your smartphone / tablet and can be exported as a .csv file. In logging mode, measurement data can also be saved without an existing Bluetooth connection. The internal flash memory of the coreLIME or coreIN measurement amplifier is used for this purpose.
... the sensors and sensor nodes
Defining and changing the names of the sensors/sensor nodes
Taring of measured values
Entering and changing the calibration values
Setting the data rate
Firmware update
... the gateways
Configuration of the analog outputs
Scaling values
Connection rules
Firmware update
coreVIEWER Custom Dashboard
Get a quick picture! As soon as you connect a torque or force sensor, all measured variables of a sensory component are clearly displayed in the dashboard, making it easy to keep an eye on the most important measured values of different components. In custom mode, you can display exactly the measured variables that are of particular interest to you - from up to four measuring amplifiers simultaneously.
View as line chart
Live value as digital display
Min/max/average value for adjustable period
Tare
Register change between connected sensors
Planning and starting the recording of measurement data
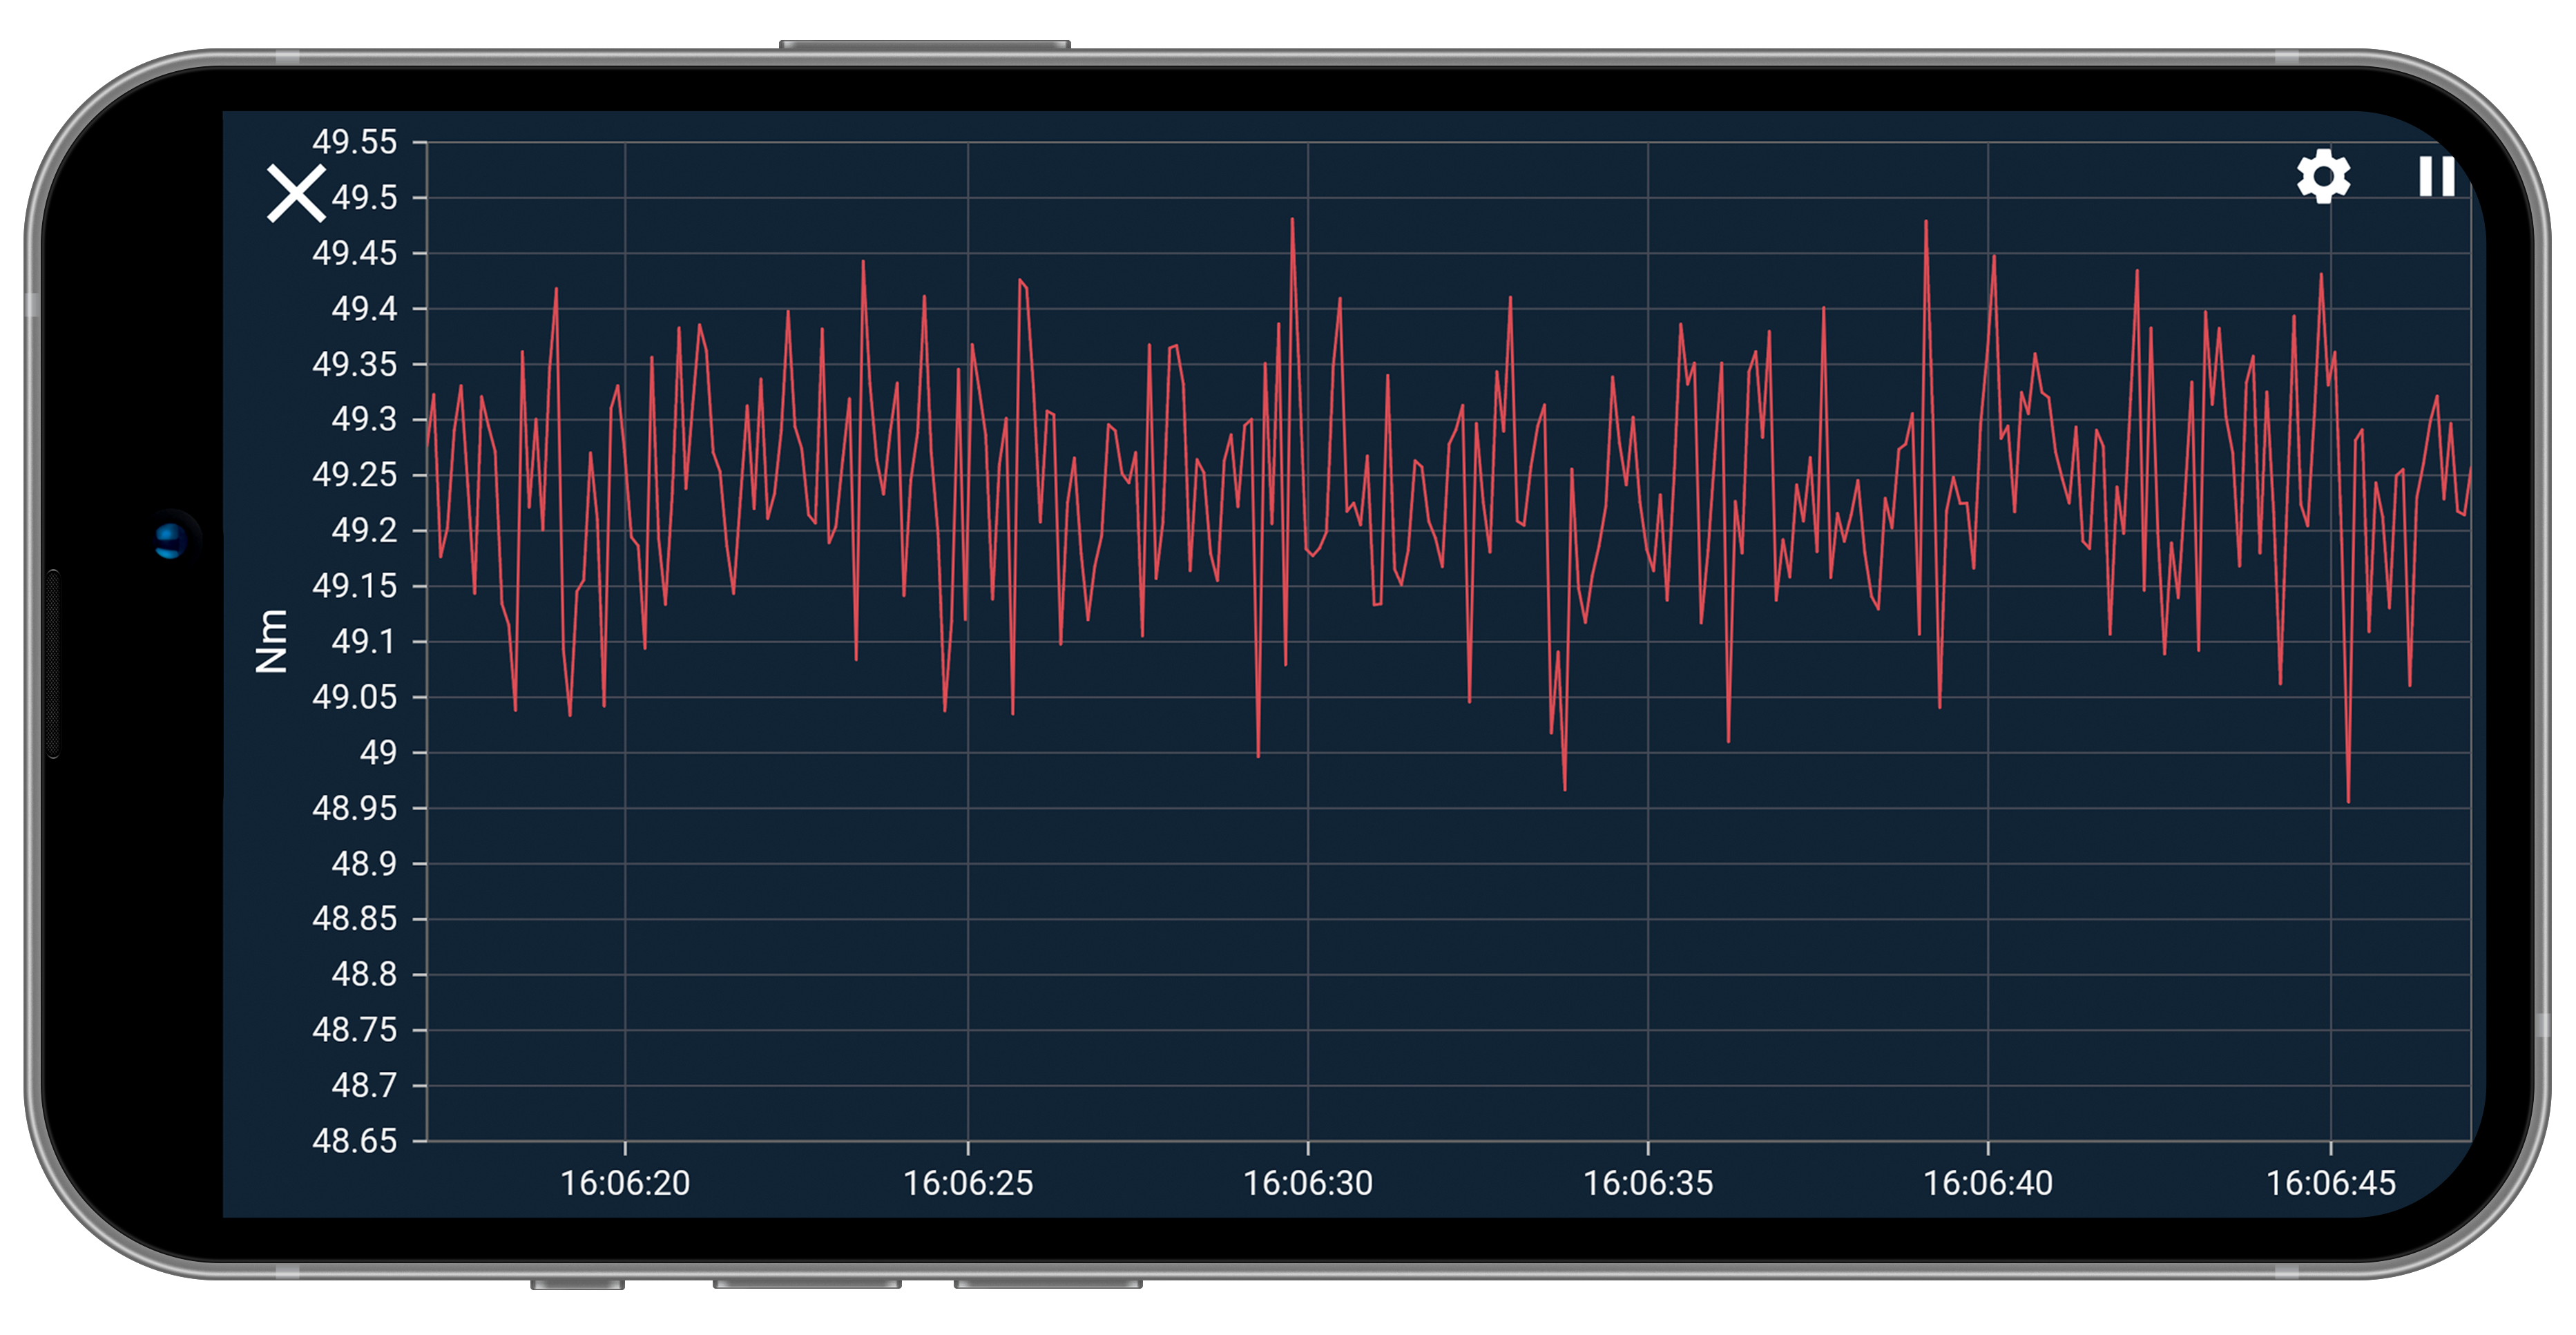
Line Chart
Display of the temporal course of the relevant measured variable in order to compare several sensors with each other at the same time.
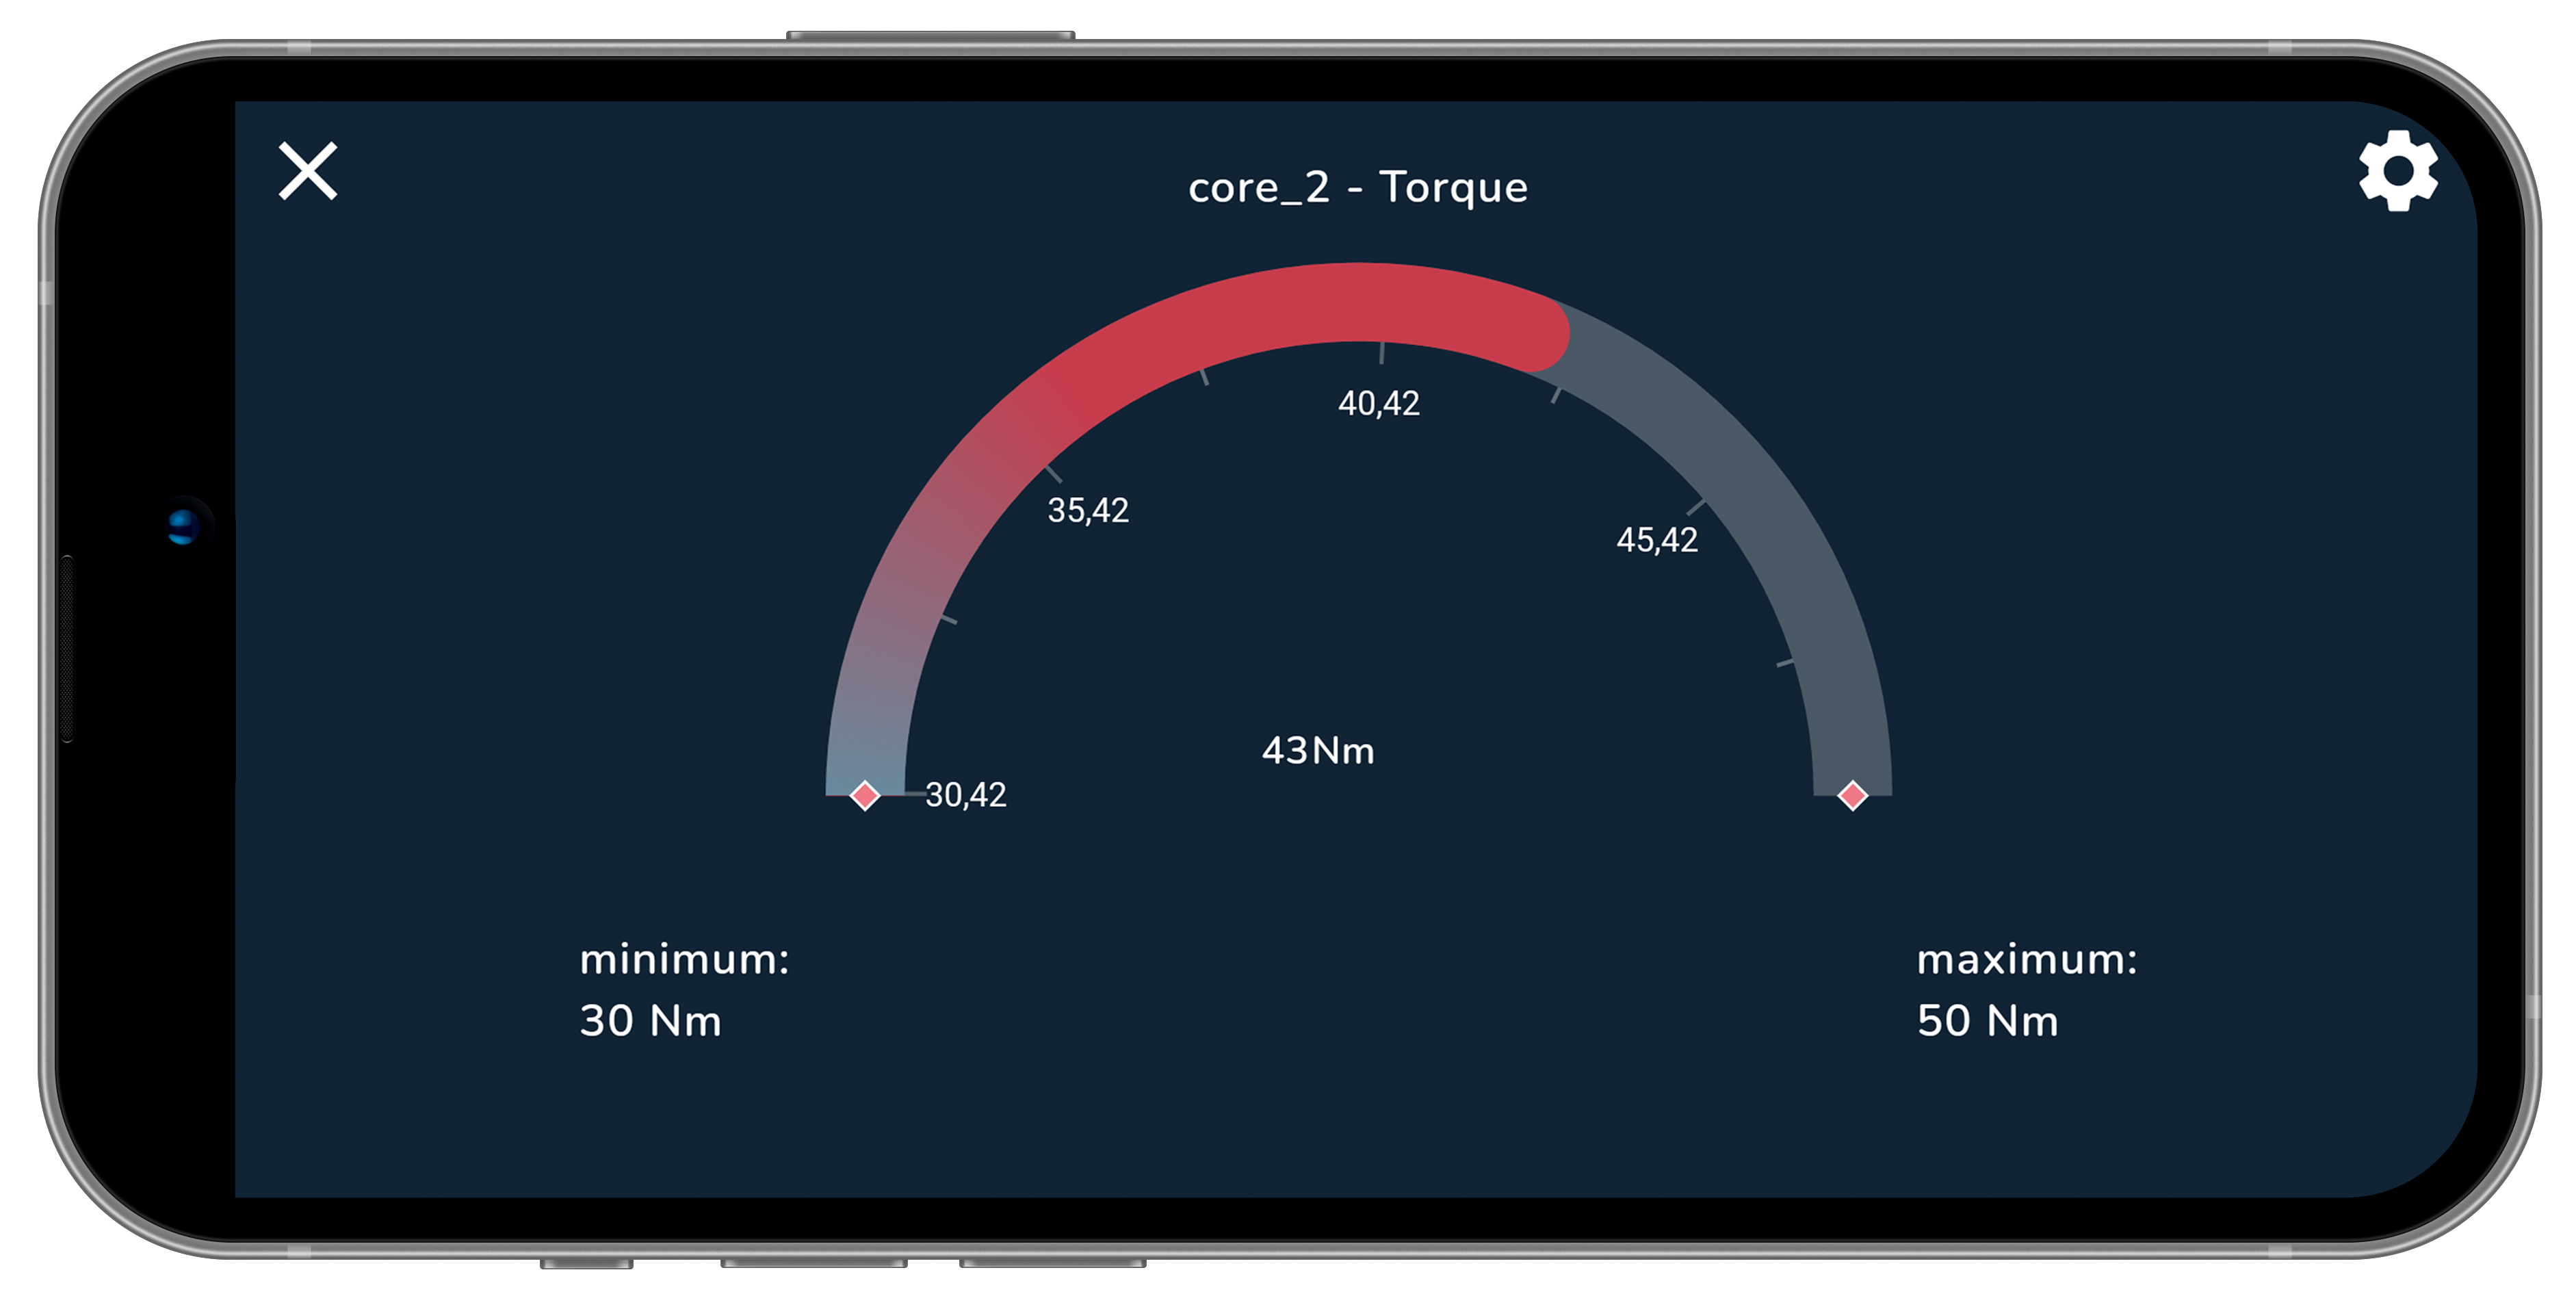
Radial Gauge Chart
Display of the sensor values in a circular and tachometer-like diagram that shows the current value in relation to the maximum and minimum value.
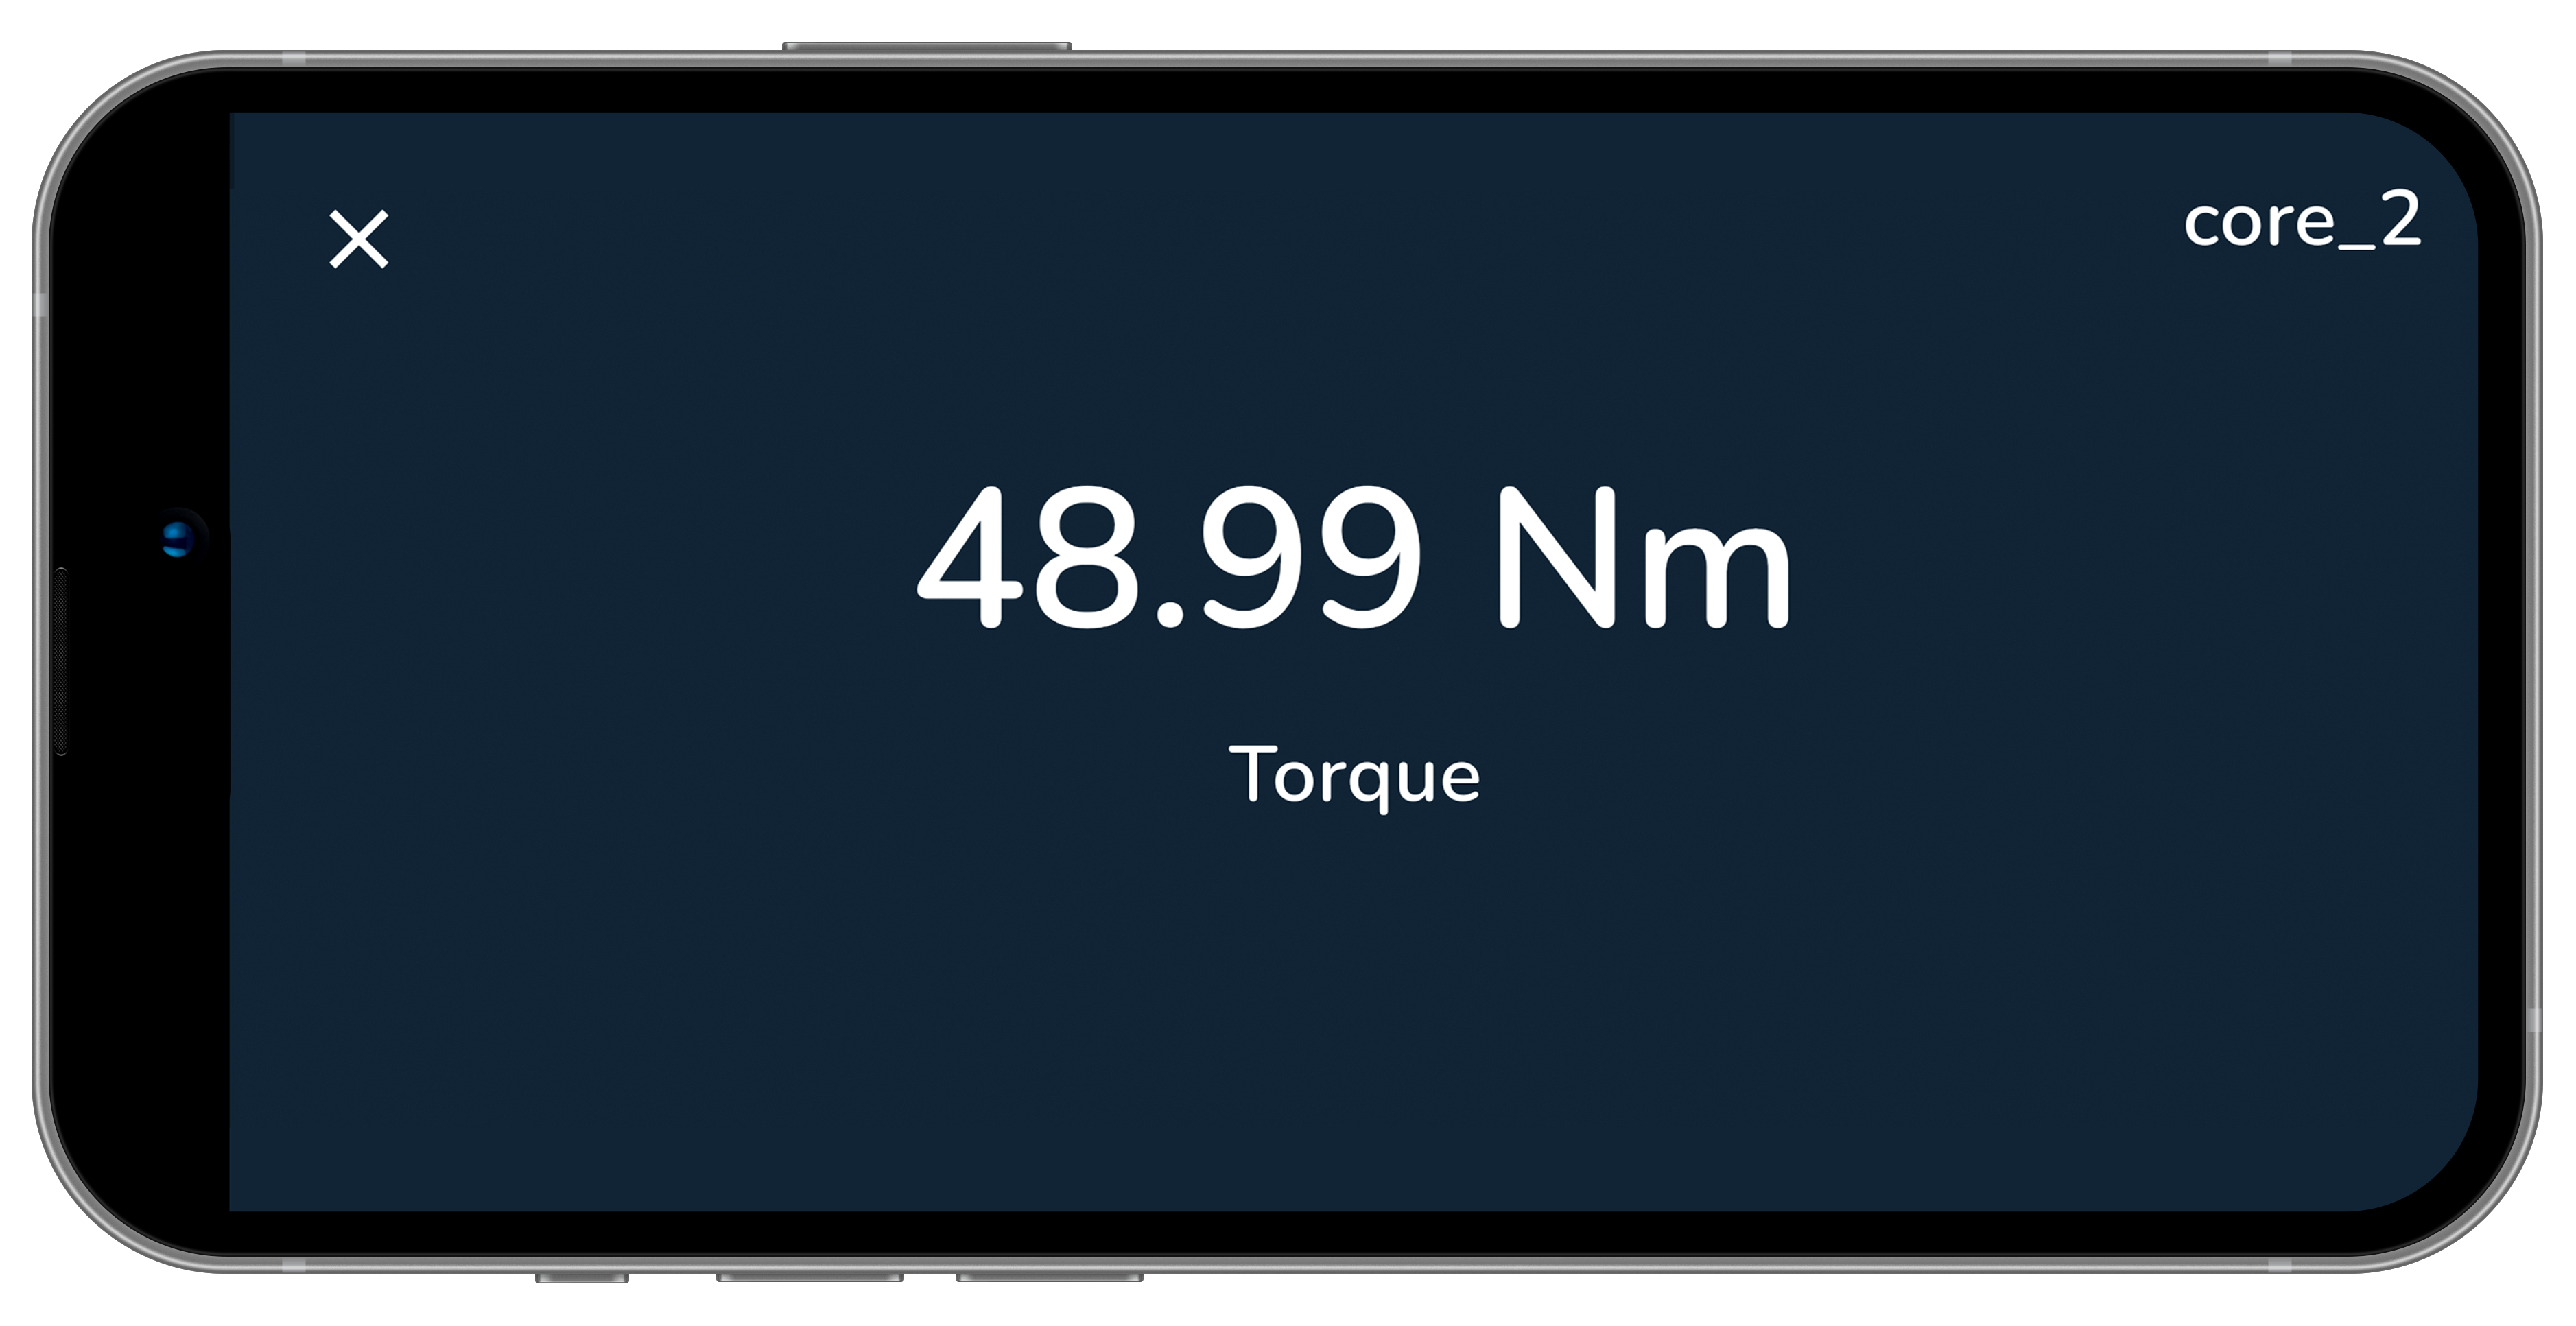
Number Widget Chart
Display of the sensor values in a numerical diagram.
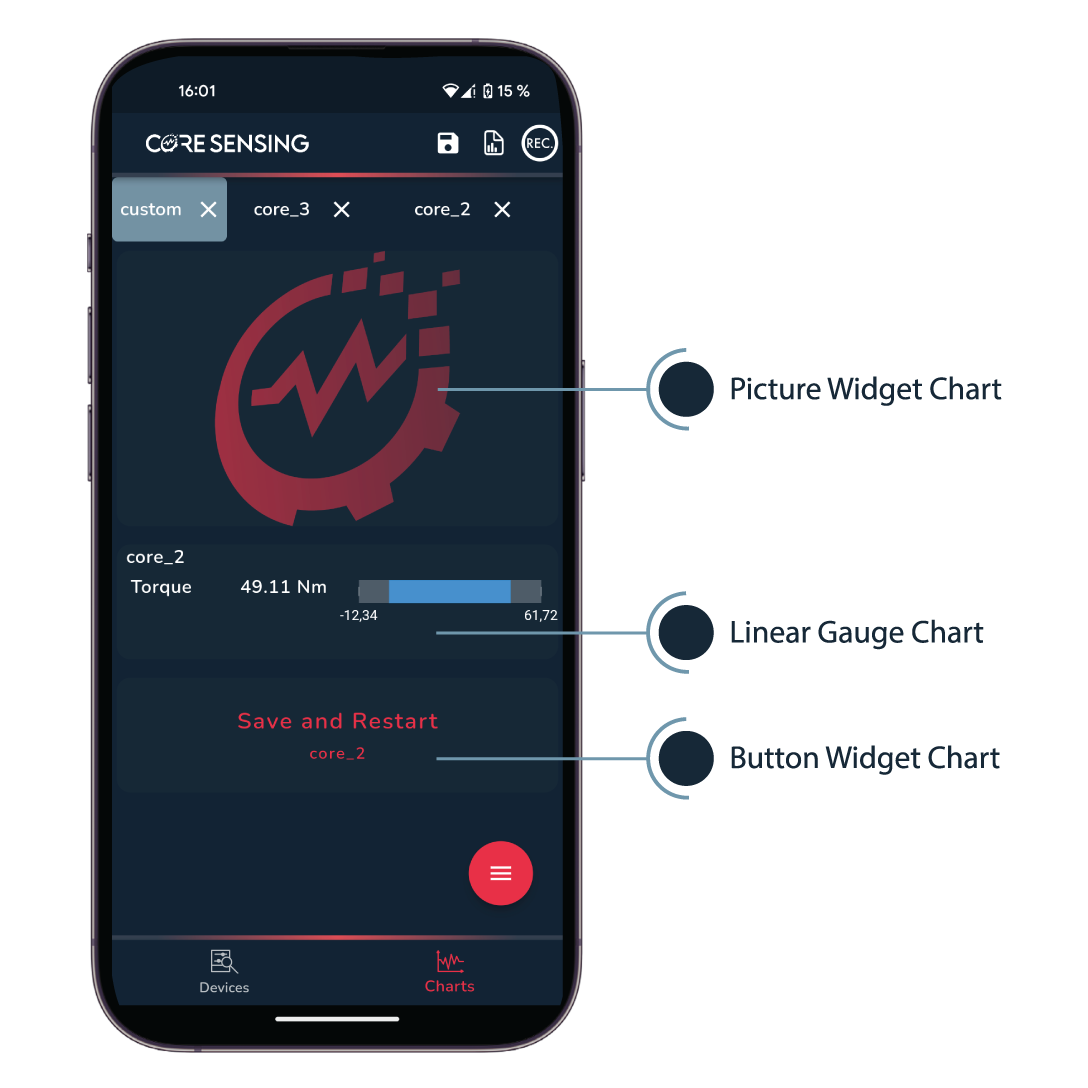
Picture Widget Chart
Display of images or symbols for a professional and customer-oriented presentation of sensor data.
Linear Gauge Chart
Display of the value range in a linear bar, which shows the current measured value in relation to the maximum and minimum value.
Button Widget Chart
Display of interactive buttons as graphic elements that are linked to specific actions in the app.
Do you have questions about coreVIEWER? Or how our smart sensor app coreVIEWER could be interesting for your application? We will be happy to answer them!